Blockchain projects often face technical, business, capital and organizational questions at the same time. Focusing on just one part can leave you familiar with many terms but unclear about how the project works.
This training material uses the Blockchain Project Operations Map [3.1] to place scattered knowledge within one structure. First identify the elements, then trace their relationships. Finally, return to a specific project and check whether value creation, collaboration rules and operational arrangements fit together.
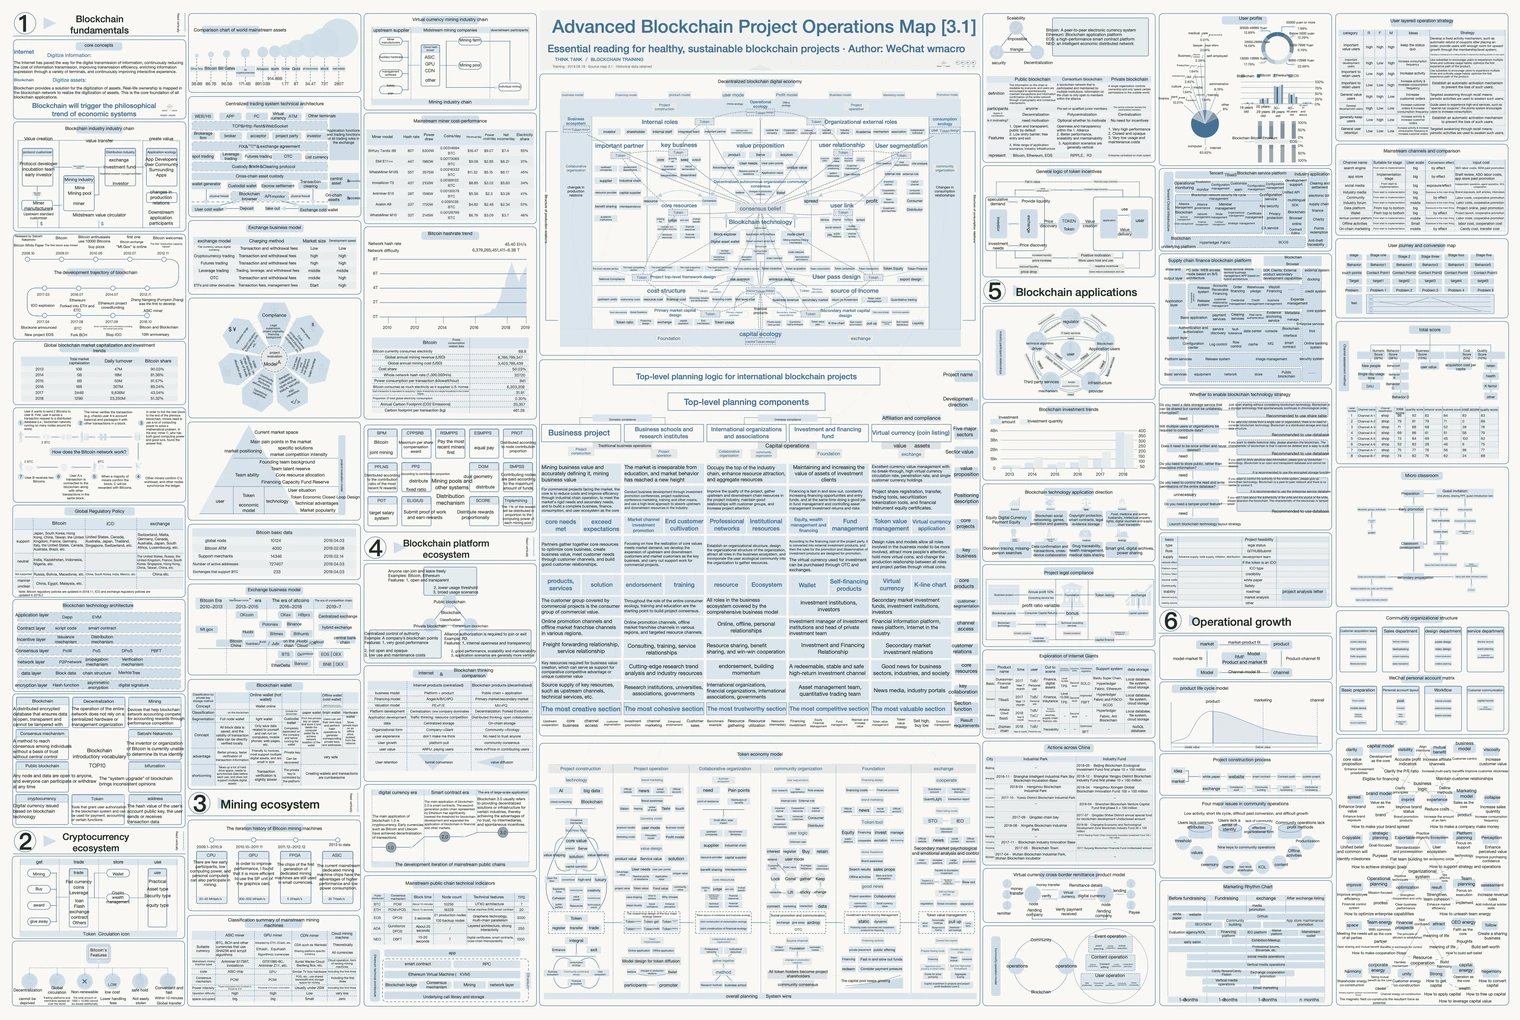 Enlarge the complete map ↗
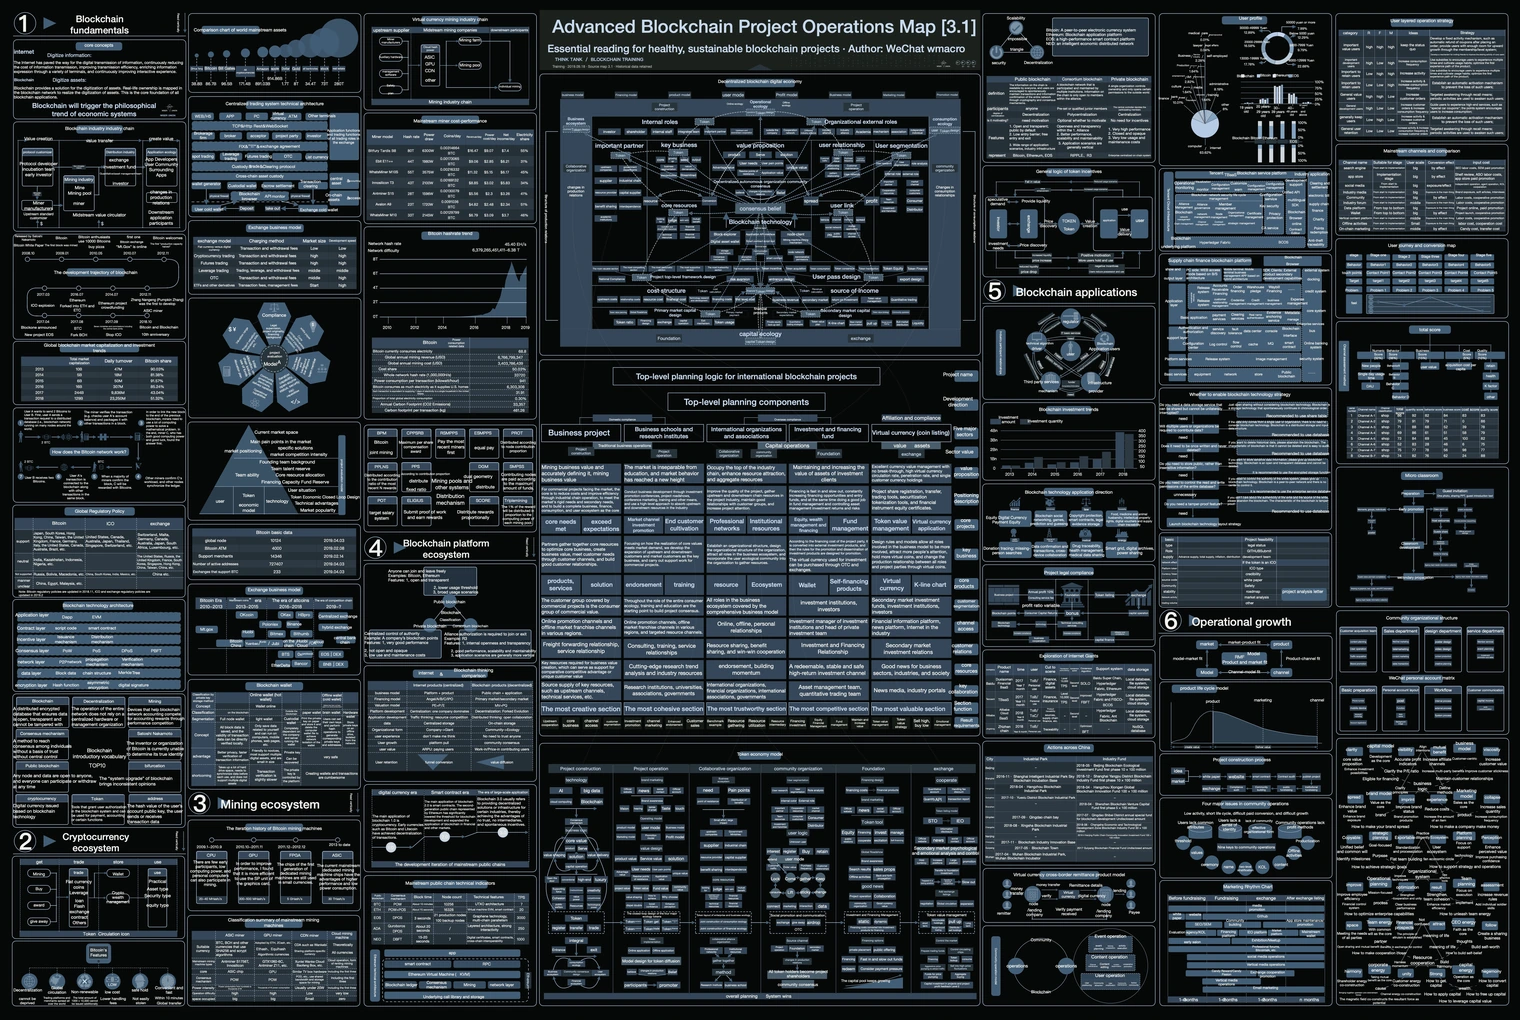
1. Learning objectives: understand the whole project
After reading and completing the exercises, try to form three judgments: whom the project creates value for; what enables participants to keep collaborating; and how technology, tokens, capital and operations support that process.
The map offers starting points for observation and discussion. Turn what you learn into your own project description, role relationships and list of rules, beyond remembering concepts.
2. Six perspectives: establish the big picture
The outer map has six areas. Read them in numerical order, or start with the area you understand least. Then return to the whole map to check its connections with the other areas.
- 01 Blockchain fundamentals
- Start with the technology, its development and basic concepts to establish a shared vocabulary.
- 02 Cryptocurrency ecosystem
- Identify issuance, trading, wallets and participant roles to understand how tokens circulate.
- 03 Mining ecosystem
- Examine computing power, equipment, mining pools and incentives to understand the resources needed to run a network.
- 04 Blockchain platform ecosystem
- Compare public and consortium chains and different technical structures, relating technical choices to organizational needs.
- 05 Blockchain applications
- Follow specific applications, project designs and value creation to see how the technology enters business.
- 06 Operational growth
- Examine users, products, channels, organization and growth to identify what sustains a project.
These six areas are connected. For example, a token's purpose affects user participation; user behavior affects operational arrangements; and operating costs affect how resources and capital are organized. Write down these connections as you read.
3. Three core models: organize the elements
A decentralized blockchain digital economy
The upper central diagram connects production relations, consumption relations and project development, showing the interactions among value, collaboration, users and capital.
Start by identifying the project's value hub. Mark the participants on the supply and demand sides, then trace resource inputs, value production, use and exchange, and the distribution of benefits.
Top-level planning logic for international blockchain projects
The middle central diagram covers business projects, business schools and research institutes, international organizations and associations, investment and financing funds, and virtual currencies. It sets out the tasks of different organizational vehicles and how they collaborate.
Check why a project needs each vehicle, what problem it solves, and whether responsibilities and connections are clear. Choose arrangements according to the needs of the specific project.
The token economy model
The lower central diagram brings project development, collaborative organizations, communities, funds and trading into one relationship map. It supports discussion of how tokens relate to value flows, participation incentives and project development.
First explain the token's uses and the conditions for obtaining it in writing, then draw its circulation paths. Each path should identify who participates, what action takes place, which rules apply, and how it is recorded and checked.
4. Project exercise: move from the map to practice
Choose a blockchain project you know, or a business idea under discussion. Describe the actual problem first, then organize the material using the table below. Where evidence is missing, keep an open question to verify.
| Dimension | Questions to answer | Materials to produce |
|---|---|---|
| Value and demand | Whom does the project serve? What problem does it solve? How is value used and exchanged? | A one-page value proposition and business process |
| Participants and collaboration | Who contributes resources? Who delivers products? Who bears costs and responsibilities? | A diagram of participant roles and responsibilities |
| Technology and records | Which activities need shared records? Which permissions must be defined? | An explanation of technical choices and permissions |
| Tokens and rules | What does the token represent? How is it obtained, used and distributed? | A list of token uses and rules |
| Capital and operations | Where do resources come from? How are costs covered? How is actual growth evaluated? | A worksheet for inputs, costs, operational goals and review |
Put the completed materials back into the map. Check which elements are clear, which relationships are still disconnected, and which arrangements lack factual support. Address the questions that affect the whole project's operation first.
5. Suggested training and discussion sequence
- Start with the whole map. Each participant identifies their most and least familiar areas. Compile a shared list of questions.
- Read the relationships. Choose one core model and explain how the project works by tracing resources, value, users and tokens.
- Complete the exercise. Fill in the observation table for a specific project, identifying materials that can be checked and assumptions that need verification.
- Review the whole map. Use the six areas to check for omissions and identify the facts, rules and responsibilities to clarify next.
At the end of the discussion, each group produces a one-page project description, a relationship diagram and a verification checklist as a starting point for further research and practice.
6. Sources and historical data
This training was published on 18 September 2019. The material has been reorganized for this page, and the diagram's colors adapted to the site's style.
The main diagram is a complete redrawing of the Blockchain Project Operations Map [3.1]. It preserves the original author's WeChat ID wmacro, the WISER UNION source mark and the original CC BY NC ND license mark. This complete English map is translated from the Chinese original, retaining its structure and historical data; this guide, exercise table and discussion sequence are accompanying editorial material.
The map contains historical data from around 2018–2019, project examples and industry terminology of that period, all retained as originally presented. Read them in their original time frame and statistical context. For new project research, separately verify the data and rules for the relevant period.